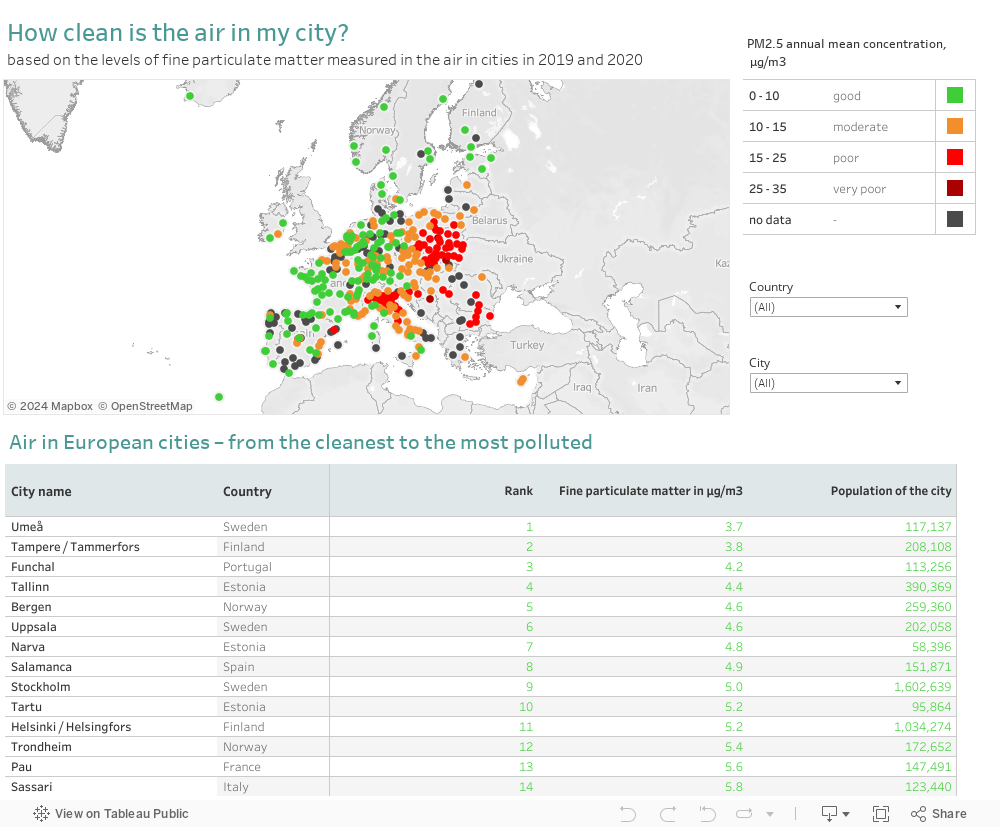
How Clean is Your City’s Air? A Searchable Map
Reading Time: 2 minutesThe European Environmental Agency makes annual comparative reports on air quality in all of the main European cities. The good part is, they make it publicly available through an interactive map, which we’ve embedded below. Check your hometown, holiday destination, or any other place that comes to mind. The map ranks air quality based on historic data on the levels of fine particulate matter measured in the air in those cities in 2019 and 2020.
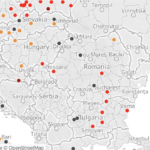
Regarding Central & Eastern Europe, the overall air quality picture isn’t rosy. Given its intense coal use in energy production, Poland is colored red and orange on the map, indicating that it ranges from moderate 12.2 μg/m3 to the extremely health threatening 27.3 μg/m3. At 17 μg/m3, Warsaw is among the most polluted capitals of Eastern Europe.
Czechia, meanwhile, has cities ranging between 10.7 μg/m3 to 19.6 μg/m3 with the capital, Prague, within the range of the average for European capitals: 12.4μg/m3. At 13.5 μg/m3, Bratislava has somewhat worse results, but the air quality is better than what the citizens of Budapest have to breathe: 14.2 μg/m3.
And then there’s Slovenia’s capital, Ljubljana, which, at 16.2 μg/m3, has worse air quality than Budapest, but better than the Romanian capital Bucharest, which registers 16.4 μg/m3. Finally, the most south-eastern European country, Bulgaria, cannot boast high air quality, its cities ranging from 16.1 μg/m3 to 22.9 μg/m3 – but there’s no data for Sofia, the country’s capital.
If you’re in search of the cleanest, most breathable air in a capital city in Eastern Europe, feel free to visit Estonia whose air measured4.2 μg/m3 of fine particulate matter. But if you’re looking for the best city air in Europe you have to go a bit more to the north to the Swedish town of Umeå.
Enjoy browsing the map!